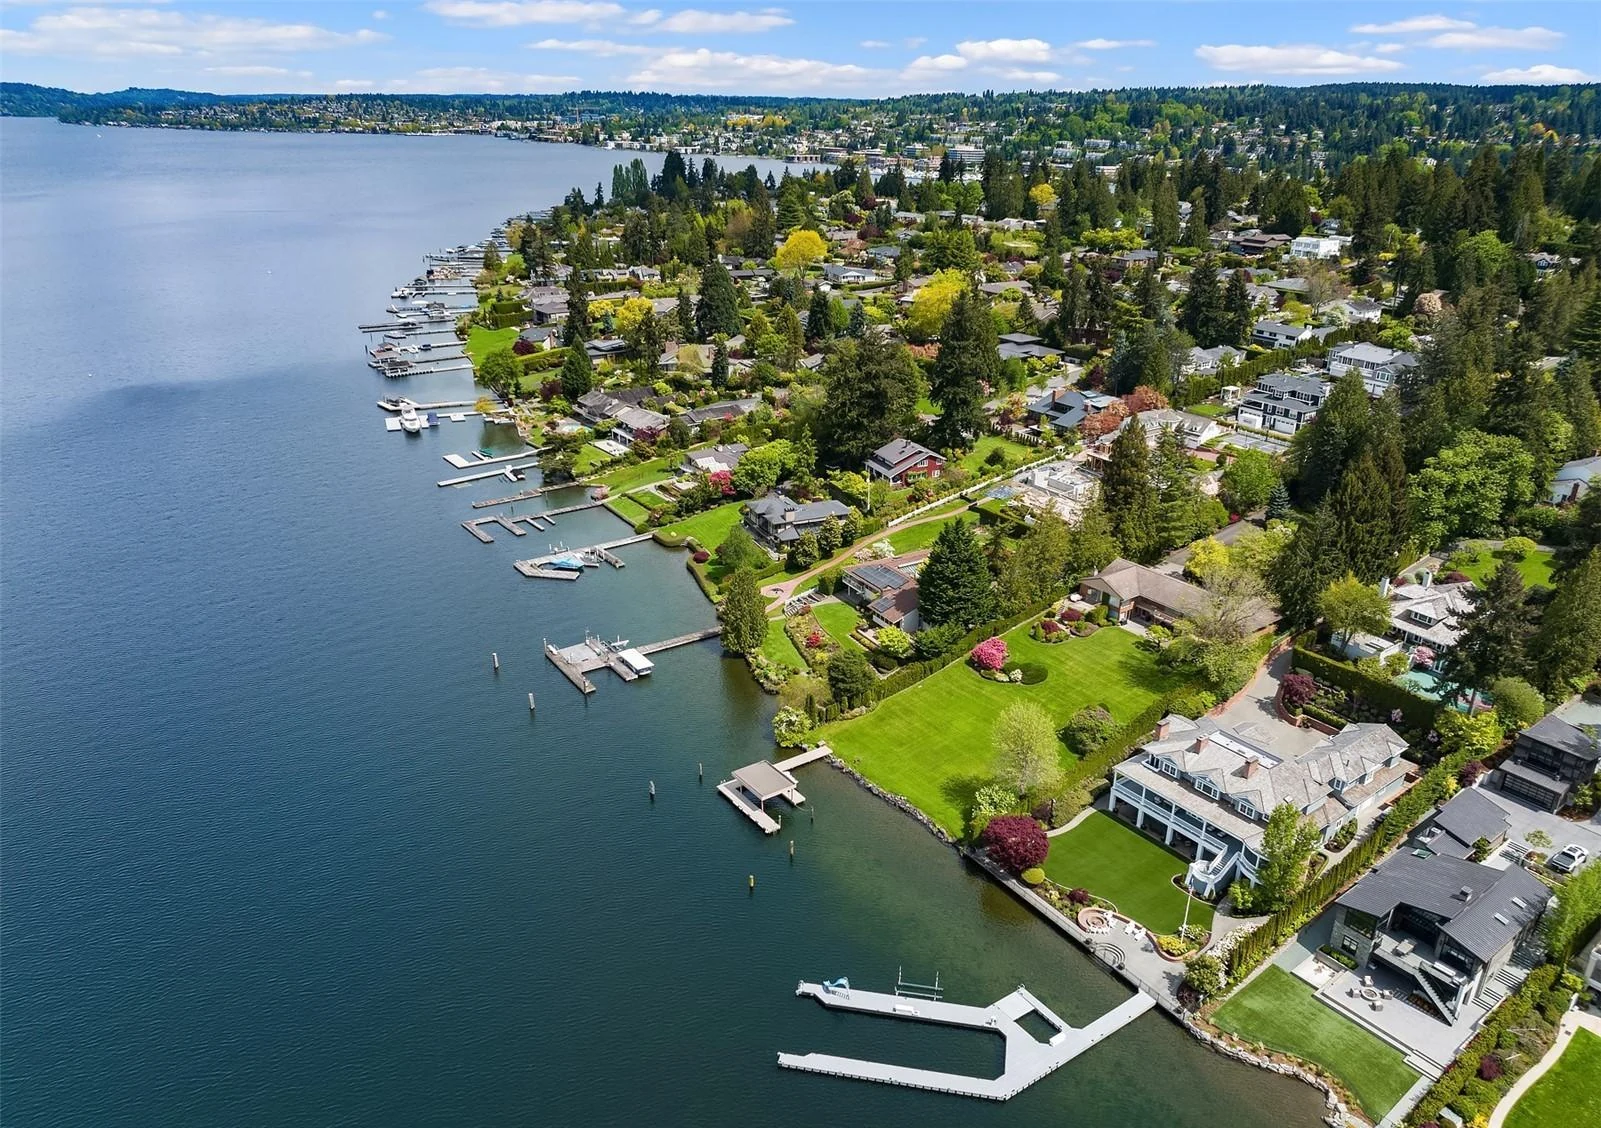
Eastside Waterfront
The Complete Waterfront Guide
At a Glance
A Quick Summary
What separates Lake Washington from Lake Sammamish, and what the numbers reveal about waterfront value.
Written by Colin Dalrymple, Managing Broker, Windermere Real Estate.
Last updated . Figures checked against the source Northwest MLS export before publishing.
Why Buyers Choose Lake Washington
Lake Washington buyers are paying for scale, history, and salt water access. At roughly 34 square miles and 22 miles end to end, about four times the size of Sammamish, it's the older, more established waterfront market, with shoreline running from Renton and Mercer Island through Bellevue, Kirkland, and the ultra-premium tier of Medina, Hunts Point, and Yarrow Point. That breadth shows up in the pricing: a $6.65M to $6.78M median with a full range stretching to $38.9M, versus Lake Sammamish's tighter $3.3M to $5.8M middle band and $13M ceiling.
Part of that premium buys something Sammamish simply cannot offer: a working route to salt water. A boat docked in Kirkland or Bellevue can travel through the Lake Washington Ship Canal and the Hiram M. Chittenden (Ballard) Locks, out through Lake Union to Puget Sound, the kind of large-boat, open-water access that draws serious boaters to Lake Washington specifically.
Why Buyers Choose Lake Sammamish
The draw here has as much to do with what surrounds the lake as the lake itself. The shoreline splits between two top-ranked school districts. Issaquah School District covers Issaquah and south Sammamish (Skyline and Issaquah High), while Lake Washington School District covers Redmond, north Sammamish, and Sammamish's east shore (Eastlake and Redmond High). Both districts consistently rank in Washington's top five statewide, and families who want a private option have Eastside Catholic, a 6-12 school right on the Sammamish Plateau, close by.
It's also a shorter, more predictable commute for tech workers: Sammamish sits roughly 10 miles from both downtown Bellevue and Redmond, typically 15 to 30 minutes outside peak traffic. And on the water, Sammamish's smaller footprint (about 8 square miles versus Lake Washington's roughly 34) makes for calmer, more contained conditions. That calm water is exactly why early Pacific Northwest water-skiers gravitated there in the 1930s and 40s, and the lake still carries a dedicated slalom course at its north end today. The market rewards that appeal with speed: Sammamish waterfront sells in a median 28 days against Lake Washington's 48, at a $4.13M to $4.15M median that puts true lakefront living within reach of far more buyers.
Why Buyers Choose Lake Washington
Larger lake with true access to Puget Sound. Boats docked in Kirkland or Bellevue can run the Ship Canal and Ballard Locks straight out to open water
Higher price ceiling, with a full range up to $38.9M, and a genuine luxury tier in Medina, Hunts Point, and Yarrow Point (median $11M–$15M)
Broader, more established shoreline, with 4x the surface area of Sammamish, spanning Renton to Medina with the Eastside's longest waterfront history
Wider mix of price points, with 1 in 5 sales closing above $10M, so there's room for both entry-level waterfront and trophy estates
Why Buyers Choose Lake Sammamish
More attainable entry point into true waterfront living, with a median of $4.13M–$4.15M vs. Lake Washington's $6.65M–$6.78M
Closer commute to Redmond and Bellevue, roughly 10 miles, typically 15–30 minutes off-peak
Smaller, calmer lake (about 8 sq mi vs. Lake Washington's 34), and historically a Pacific NW watersports hub
Top-rated public schools (Issaquah SD and Lake Washington SD both rank in the state's top five) plus Eastside Catholic, a private 6-12 school right on the Sammamish Plateau
Lake Washington and Lake Sammamish aren't competing markets. They're different products. Lake Washington offers a long-established waterfront market with boating access to Puget Sound and a broad mix of shoreline communities. Lake Sammamish offers a faster-moving, more attainable entry into true lakefront living with mountain views. Which one is better depends entirely on what you're optimizing for.
What’s Happening Right Now
Two recent windows tell a consistent story. Since September 1, 2025 (79 qualifying sales), and separately the trailing 12 months of August 11, 2025 through July 30, 2026 (84 qualifying sales), both point the same direction. The table below uses the September 2025 window because it is the more recent of the two.
| Metric | Lake Washington | Lake Sammamish |
|---|---|---|
| Sales (Sept. 2025 to present) | 54 | 25 |
| Median sold price | $6.78M | $4.15M |
| Median $/sq. ft. | $1,667 | $1,313 |
| Median days on market (cumulative) | 48 | 28 |
| Sale-to-list ratio | 95.9% | 97.0% |
| Sold above asking | 1.9% | 4.0% |
| Median $/waterfront foot | $88,062 | $64,391 |
For the trailing 12-month window (August 2025 through July 2026, 57 Lake Washington sales and 27 Lake Sammamish sales), the median sold price runs $6.90M and $4.40M respectively, with a middle-50% range of $5.0M to $10.15M on Lake Washington and $3.46M to $5.90M on Lake Sammamish. Both windows are valid. You'll see the median shift again later to $6.65M and $4.13M when we pull in all 398 sales back to 2021, simply because a longer lookback pulls in more of the lower-priced years. The takeaway doesn't change: the gap between the two markets has widened slightly in the most recent 12 months compared with the five-year picture.
The most useful stat for buyers right now: Lake Sammamish homes are moving in 28 days versus 48 on Lake Washington, measured as cumulative days on market. Combined with a stronger sale-to-list ratio (97% versus 95.9%) and a higher above-asking rate (4% versus 1.9%), Sammamish is currently the more competitive market, even at the lower price tag. That isn't a weak-demand story. It's a tighter, hotter market at a lower entry price.
Ranges, Not Just Medians
A single median hides how differently these two markets behave. Here is the middle 50% of sales (25th to 75th percentile) alongside the full spread.
| Metric | Lake Washington | Lake Sammamish |
|---|---|---|
| Sales analyzed (all-time) | 271 | 127 |
| Sold price, middle 50% | $4.4M – $9.3M | $3.3M – $5.8M |
| Sold price, full range | $1.4M – $38.9M | $1.5M – $13.0M |
| Median sold price | $6.65M | $4.13M |
| $/sq. ft., middle 50% | $1,127 – $2,082 | $981 – $1,434 |
| $/sq. ft., full range | $565 – $5,603 | $476 – $6,802 |
| Median $/sq. ft. | $1,530 | $1,197 |
| Median waterfront frontage | 75 ft | 68 ft |
| Median price per waterfront foot | $92,555 | $62,144 |
Lake Washington runs roughly 28% higher per square foot than Lake Sammamish at the median, and about 49% higher per waterfront foot. The more useful insight, though, is the shape of each market rather than its center point.
Where Sales Actually Land
| Price band | Lake Washington | Lake Sammamish |
|---|---|---|
| Under $3M | 11% | 20% |
| $3M – $5M | 21% | 46% |
| $5M – $7M | 24% | 26% |
| $7M – $10M | 23% | 5% |
| $10M – $15M | 11% | 2% |
| $15M+ | 10% | 0% |
This is the real story. Lake Sammamish is a tight, predictable market: nearly 72% of all sales cluster in the $3M to $7M band, and essentially none clear $10M. Lake Washington spreads far more evenly across the entire range, with a genuine luxury tail. One in five sales closes above $10M and 10% close above $15M.
Lake Washington isn't simply pricier at the median. It is a fundamentally wider, less predictable market with room for both entry-level waterfront and trophy estates. Lake Sammamish is the more consistent, easier-to-forecast market of the two.
Waterfront Frontage Scarcity
Price per square foot describes the house. It doesn't describe what is actually scarce on waterfront: the shoreline itself. And frontage doesn't price out in a straight line. It curves sharply the smaller the lot gets.
| Frontage | Median Price per Waterfront Foot |
|---|---|
| Under 40 ft | $125,000 |
| 40 – 60 ft | $85,667 |
| 60 – 80 ft | $83,125 |
| 80 – 120 ft | $74,695 |
| 120+ ft | $50,863 |
A home with 35 feet of shoreline commands nearly 2.5 times more per foot than a home with 130 feet. That is the classic scarcity curve: narrow lots are rarer and command a higher price per linear foot, even though the total price is usually lower. It's a genuinely useful lens for both sides of a deal. A buyer comparing two homes at similar total price but very different frontage is not comparing equivalent assets, and a seller with a narrow lot may be underpricing if they think only in price-per-square-foot terms.
Price per waterfront foot, by lake
Frontage value doesn't only curve by lot size. It varies dramatically by lake, and the spread within each lake is nearly as wide as the gap between them.
| Metric | Lake Washington | Lake Sammamish |
|---|---|---|
| Middle 50% (25th to 75th pct.) | $70,630 – $133,581 | $47,692 – $79,960 |
| Median | $92,555 | $62,144 |
| Full range | $13,305 – $365,667 | $683 – $350,000 |
| Value per foot | Lake Washington | Lake Sammamish |
|---|---|---|
| Under $40K | 5% | 15% |
| $40K – $60K | 13% | 30% |
| $60K – $80K | 19% | 31% |
| $80K – $110K | 23% | 18% |
| $110K – $150K | 21% | 4% |
| $150K+ | 19% | 2% |
About 44% of Lake Sammamish waterfront lots sell for under $60,000 per foot, while roughly 4 in 10 Lake Washington lots sell above $110,000 per foot. There is real overlap in the middle, and a well-priced Lake Sammamish lot with premium frontage can out-value a mid-tier Lake Washington lot. The tails, though, barely overlap: Lake Washington produces nearly all of the sales above $150,000 per foot, and Lake Sammamish nearly all of the sales under $40,000 per foot.
A Long-Established, Premium Shoreline
Lake Washington waterfront runs through Mercer Island, Bellevue, Kirkland, Medina, Hunts Point, Yarrow Point, Clyde Hill, and Renton, the Eastside's most established and highest-priced shoreline. Because it connects to Puget Sound via the ship canal and Ballard Locks, it offers true boating access to open water, which underpins much of its premium over inland lakes.
| City | Sales | Sold Price (25th to 75th pct.) | Median Price | $/Sq. Ft. (25th to 75th pct.) |
|---|---|---|---|---|
| Hunts Point | 12 | $7.85M – $18.3M | $14.9M | $2,266 – $3,381 |
| Medina | 22 | $8.4M – $17.9M | $11.2M | $1,469 – $2,620 |
| Yarrow Point | 10 | $8.9M – $14.7M | $11.0M | $1,555 – $2,854 |
| Mercer Island | 91 | $4.2M – $8.9M | $6.75M | $942 – $1,764 |
| Bellevue | 53 | $5.1M – $7.7M | $6.65M | $1,347 – $2,143 |
| Kirkland | 62 | $4.6M – $7.4M | $6.21M | $1,189 – $2,134 |
| Clyde Hill | 2 | $3.7M – $4.8M | $4.29M | $1,173 – $1,280 |
| Renton | 19 | $2.9M – $3.7M | $3.2M | $986 – $1,324 |
Hunts Point, Medina, and Yarrow Point form their own tier entirely, with median prices of $11M to $15M and price per square foot north of $2,000, more than double what the rest of Lake Washington commands. These three tiny cities (combined population under 2,000) drive most of the eye-catching headline numbers.
Renton carries the lowest price per square foot on Lake Washington. Same lake, same boating access, at roughly 70% to 73% of Kirkland's price per square foot. Its range is also the tightest on the lake ($2.9M to $3.7M), which makes Renton pricing unusually consistent.
Mercer Island has the widest range relative to its median of any Lake Washington city: a 25th to 75th percentile spread of $4.2M to $8.9M around a $6.75M median. It is one city with a genuinely broad mix, from modest lakefront cottages to major estates.
The two highest sales in the data set were $38M and $38.9M, both in Medina and Hunts Point, including a $38.9M Evergreen Point sale at nearly $2,900 per square foot. Across the full data set, 15.5% of waterfront sales closed above $10M and 14 sales closed above $20M.
Price growth 2021 to 2026: Lake Washington's median price per square foot climbed from about $1,495 to $1,667, roughly 12% appreciation over five years, calculated as the median price per square foot among sales closing in each calendar year.
Faster Moving, More Attainable
Lake Sammamish waterfront runs through Sammamish, Issaquah, Redmond, and eastern Bellevue, offering mountain views and a meaningfully lower cost of entry than Lake Washington.
| City | Sales | Sold Price (25th to 75th pct.) | Median Price | $/Sq. Ft. (25th to 75th pct.) |
|---|---|---|---|---|
| Sammamish | 51 | $3.2M – $6.15M | $4.28M | $1,071 – $1,661 |
| Redmond | 13 | $3.5M – $4.4M | $4.0M | $971 – $1,161 |
| Issaquah | 18 | $2.5M – $6.0M | $4.0M | $897 – $1,321 |
| Bellevue (east side) | 45 | $3.4M – $5.2M | $4.0M | $943 – $1,332 |
Redmond has the lowest price per square foot in the Lake Sammamish sample. Its median sold price is comparable to Sammamish and Issaquah, but it sits under $1,000 per square foot. It is also the tightest, most predictable market on this lake ($3.5M to $4.4M), the opposite of Sammamish and Issaquah, which both span roughly $2.5M to $6M.
Sammamish and Issaquah have nearly identical medians (about $4.0M to $4.3M) but very different shapes. Both stretch from the mid $2M range to $6M, so a median comparison hides a wide mix of property types and price points inside each city.
Price growth 2021 to 2026: Lake Sammamish's median price per square foot climbed from about $1,167 to $1,288, roughly 10% appreciation over five years, compared with Lake Washington's roughly 12%. Both lakes are appreciating, but Lake Washington has edged ahead on a percentage basis.
Note: Sammamish also contains Pine Lake, Bellevue contains Phantom Lake, and Newcastle contains Lake Boren, smaller separate bodies of water sometimes mixed into city-level waterfront data. Those sales were excluded here to keep this a true Lake Washington versus Lake Sammamish comparison.
What Buyers Are Actually Looking At
Across both lakes, the most common single view combination in this data set is lake, mountain, and territorial (73 sales), followed by lake-only views (54 sales) and lake-plus-mountain (48 sales). Roughly 58% of all sales include a mountain view alongside the water, a meaningful differentiator when two homes have similar frontage and square footage.
On bank type, 43% of sales are no-bank waterfront, meaning flat lots where you walk straight to the water. That is the most common configuration by sales volume, while bulkheaded shoreline made up about 29% of sales. No-bank and low-bank properties dominate volume, consistent with easy water access being a feature buyers prioritize.
What this means for you
Two Markets, Two Different Products
For Sellers
Positioning & Pricing
A sale-to-list ratio of 97.0% on Lake Sammamish and 95.9% on Lake Washington over the past year is a reminder that a waterfront address alone doesn't guarantee a bidding war. Only 4.0% of recent Lake Sammamish sales closed above asking, and just 1.9% did on Lake Washington, fewer than 1 in 20 on either lake, and fewer than 1 in 50 on Lake Washington specifically. The best-performing listings combine sharp positioning, comp-driven pricing using true shoreline comparables rather than city or square-footage numbers, and a narrative that gives buyers confidence in condition and potential.
For Buyers
Negotiation & Due Diligence
Negotiation is very much still part of this market on both lakes. Before writing an offer, look past price per square foot to bank type, frontage, dock and moorage rights, and the handful of truly comparable shoreline sales.
The bottom line
Lake Washington and Lake Sammamish are not two versions of the same product. They are different markets with different buyers, different price shapes, and different sources of value. The right strategy depends on which side of the transaction you're on and which lake you're focused on.
What Makes Waterfront Property Different
Waterfront property comes with a layer of complexity that inland listings simply don't have. Lake Washington and Lake Sammamish illustrate why.
Know What You Actually Own
A waterfront address doesn't always mean deeded access to the water. Riparian and lake-access easements are common, so a title search should confirm whether the parcel actually carries water rights, or whether shoreline access is controlled by an HOA, shared dock agreement, or neighboring lot.
Look closely at
- Deeded water rights
- Shared docks or moorage
- Lake-access easements
- HOA or lake association agreements
The Shoreline Comes With Rules
Because both lakes are salmon-bearing waters, dock, bulkhead, and shoreline work can involve significant permitting. Work may require a Hydraulic Project Approval from Washington Department of Fish and Wildlife, along with local permits. Construction can also be limited to a narrow in-water work window to protect fish habitat.
Maintenance is another consideration. Bulkheads, retaining walls, and shoreline stabilization can require geotechnical review and additional permitting.
The Water Level Matters
The two lakes behave differently. Lake Washington is regulated by the Ballard Locks, keeping its water level relatively steady throughout the year.
Lake Sammamish has no locks and can fluctuate several feet seasonally. King County flood data found that many Lake Sammamish docks were built below the lake's 2-year flood recurrence level, meaning seasonal high water can affect docks and shoreline structures. For buyers, that can mean more maintenance, and more to investigate before purchasing.
Don't Forget the Ongoing Costs
Waterfront ownership can bring expenses that aren't obvious from the listing price.
Flood Risk
FEMA zones and potential insurance costs
Shared Access
HOA, dock and lake-association agreements
Water Quality
Seasonal advisories and lake monitoring
Shoreline Condition
Bank type, water depth and future maintenance
What This Means for You
City and lake-wide medians are a useful starting point, but they can't tell you what a specific stretch of frontage, bank type, or dock setup is actually worth. If you're weighing a purchase or sale on either lake, the next right step is a shoreline-specific comp pull, one that accounts for frontage, view corridor, and bank type rather than just square footage. Reach out anytime to talk through what a particular property is worth in this market.
Schedule a Meeting with ColinKeep Exploring
Related to Eastside Waterfront
Part of The Eastside.
Waterfront
Lake Washington
Pick which Lake Washington shoreline market to shop, then go to that market's waterfront guide.
Waterfront
Lake Sammamish
Compare the east and west shores of Lake Sammamish before shopping a specific stretch of frontage.
Guide
Waterfront Due Diligence
Work through what to verify on a lakefront property before the contingency closes.